


May 2026 spot prices hit six-year lows across the mainland, Cal-27 forwards set historical lows mid-month before partially recovering, and ASX trading reached a two-year high. Yet Q2-26 forwards still trade at a premium relying on a strong or volatile June spot.
Summary
May 2026 closed with spot prices at six-year lows across the mainland, Cal-27 forwards setting fresh historical lows mid-month before partially recovering, and ASX trading activity at its highest level in two years. Forward prices for the current quarter continue to carry a premium to our Learning Model median forecast across all mainland Regions, most pronounced in SA and VIC.
- Spot prices: May delivered the lowest monthly average in five years across all mainland states, with the FY-25/26 year-to-date average on track to be the lowest six-year average for every east-coast Region
- Trends: Since September 2025 spot prices have stepped-down in QLD, NSW and VIC. While SA has been remarkably consistent over the last 4 months, and TAS over the last 5-months
- Q2-26 forward journey: prices bottomed mid-month before bouncing on winter weather and firmer spot, finishing close to where the month began for the major Regions
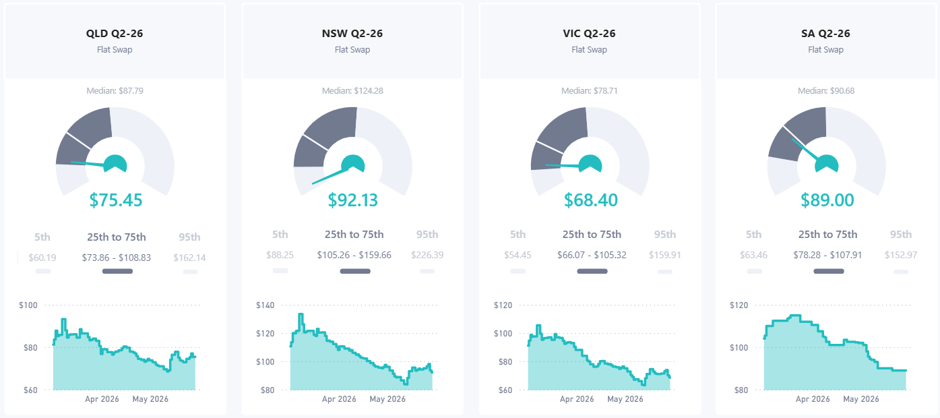
- Q2-26 Versus our Learning Model Forecast: every mainland Region carries a premium to our end-of-quarter median Learned forecast — SA the widest ($15.96/MWh above our median at the 81st percentile), VIC next ($11.50/MWh, 79th), NSW ($10.45/MWh, 69th) and QLD ($7.14/MWh, 72nd). June will need a sustained lift in the underlying prices or volatility to hold these values
- Cal-27: QLD, NSW, VIC and SA each set fresh all-time lows about mid-May before recovering modestly into month-end; meanwhile TAS finished at $74.70/MWh, above its February low
- ASX activity: May 2026 was the most heavily traded month in two-years. Swaps were the strongest since May-24 and Average Rate Options traded in May set a record. The Q2-26 quarter has already traded 87,877 MW with a month to run, on track to challenge the Q2-24 record (99,895 MW) especially if June brings spot volatility.
Over the last few months we have been re-building our datahub incorporating AI tools to produce the charts quicker and with greater diversity. You will see over the coming months further exciting enhancements released to energybyte as we roll-out the changes. This month, we begin with a new chart template.
Current Quarter Outcomes
Power spot prices continue to track below expectations, taking the average spot price for May to its lowest level in five years across all mainland states. Year-to-date FY-25/26 spot price averages are also on track to deliver the lowest six-year average for all east-coast Regions.
The chart below shows the monthly spot prices since January 2025 for each Region. and you can see that spot prices have been much lower since September 2025 for most Regions.
Across the past six years, May 2026 recorded the lowest average spot price for all Regions except TAS.
As a consequence of the lower-than-expected spot outcomes, the forward market for the current quarter of Q2-26 reached a bottom around mid-month (13 May) and then bounced, buoyed by the change to winter weather conditions driving stronger spot prices. However, the net result is the current quarter has ended close to where it began at the start of the month for the major trading Regions, while SA has slipped.
Looking at the current quarter forward price and our spot forecast before the quarter started, we find:
- QLD is located just above our 25th percentile
- NSW is exceptionally low, tracking about our 10th percentile
- VIC was trading near our median, but the recent softness last week has pushed expectations closer to just above the 25th percentile
- SA is just below our median forecast
Our Learning Model trains our probabilistic forecasts daily during the active quarter to learn from recent trends. From our Q2-26 end-of-quarter forecast, we note that:
- QLD latest forward price of $75.45/MWh compares to our median current forecast of $68.31/MWh, implying a premium of $7.14/MWh and near our 72nd percentile
- NSW current forward price of $92.13/MWh compares to our median forecast of $81.68/MWh, carrying a premium of $10.45/MWh and sits at our 69th percentile
- VIC latest forward price of $68.40/MWh has a higher premium of $11.50/MWh compared to our 50th percentile forecast of $56.90/MWh sitting at the 79th percentile
- SA latest forward price of $89.00/MWh is holding the highest premium (81st percentile) of $15.96/MWh compared to our 50th percentile forecast of $73.04/MWh
June is the final month of the quarter, and delivering current forward values will require a sustained higher spot price outcome and/or volatility.
In our next article, we will have a closer look at the drivers of the spot price outcomes.
Forward Prices
Cal-27 forward prices have softened during May:
- QLD Cal-27 reached the lowest in its history by reaching $78.51/MWh on the 12 May and has finished at $79.15/MWh at the end of the month
- NSW Cal-27 also reached the lowest point in history at $91.29/MWh on 13 May and finished at the end of the month at $94.34/MWh
- VIC Cal-27 reached $69.57/MWh on 13 May, also the lowest in history, and finished at $71.48/MWh
- SA Cal-27 reached $81.80/MWh on 13 May the lowest in history and finished at $83.23/MWh
- TAS Cal-27 finished at $74.70/MWh, but was lower in February this year at around $73/MWh
You can look at all the forward years for each Region over the last 12-months in the chart below and see how the market rallied after the Middle East conflict began and peaked around late March, before declining generally through to mid-May, and then bounced upward.
ASX Trading Activity
The month of May is typically a heavily traded month due to the approach of the next financial year, the release of the draft Deemed Market Offer and Victorian Default Offer usually drives buying activity, and the expiry of Q3-26 and FY-26/27 options.
The month of May 2026 was the most heavily traded month for 2-years. Swaps surged during the month and were the most traded since May-24, and Average Rate Options were the highest on record, driven by an increase in both Calls and Puts. The $300/MWh cap market is a critical instrument but only represents a small proportion of the trading activity.
The most heavily traded periods during the month were Q1-27 (11,865 MW), Q3-26 (11,651 MW) and Q2-26 (11,598 MW).
The most heavily traded second quarter on record was 2024 (99,895 MW). With a month still to run, the current quarter has already traded 87,877 MW, exceeding the same period in 2022 (62,538 MW), 2023 (80,918 MW) and 2025 (83,588 MW). If any spot volatility during June 2026 occurs, it is especially likely to lead to trading activity exceeding Q2-24 levels and set a record.
Disclaimer and Notes
Energybyte is published by Empower Analytics Pty Ltd (ABN 38630239002), Authorised Representative no 1274453 of Capital Treasury Solutions (AFSL 429066). Any questions or feedback must be directed to Empower Analytics Pty Ltd as the sole publisher.
