


The results of January to April are showing the market is facing structural changes that are forcing a downward price correction. Renewable growth is displacing coal, gas and mainland hydro, while BESS are suppressing evening peak prices.
1.0 Summary
In reviewing Q1-26 and the early trends from Q2-26 (i.e. April), we note:
- Spot prices were benign which is forcing a significant correction of the forward markets, following the trend that began in July 2025
- The forward markets Sellers Profit was exceptionally high and continues the trend of the spot market struggling to meet pre-quarter expectations
- When compared to 12-months ago, the renewable sector has grown and displaced coal, gas and mainland hydro
- Battery energy storage systems have also grown over the last 12-months, although the maximum charging load is less than the growth in the renewable sector during the day. The charging window is increasing as the average duration of the BESS industry increases, and during peak times the increased competition is keeping evening peak prices contained
- Looking at April, the same trends are continuing of soft spot prices and the forward market is under pressure
- Looking forward, if the spot market continues the trend of under-performing against forward market expectations during the balance of Q2-26, then the forward market downward pressure on all future quarters will continue
2.0 What happened?
This section recaps on the Q1 and April spot prices, measured the forward market Sellers Profit, and then reviews the forecasting accuracy of the forward market and our probabilistic spot forecasting model.
2.1 Spot Prices for Q1 and April
Q1-26 spot prices were largely subdued. QLD ($65.37/MWh), NSW ($73.44/MWh) and VIC ($42.71/MWh) were the lowest in 5-years. SA held steady at $88.05/MWh mainly due to the Australia Day extreme price event.
TAS continues to stand apart, finishing at $94.21/MWh, lower than last year’s average of $111.46/MWh and becoming the fourth highest since 2017.
April spot prices have followed the trends of Q1-26 with low outcomes. The April monthly average for QLD ($53.31/MWh) and VIC ($35.68/MWh) was the lowest for the last 6-years, and for NSW ($59.73/MWh) and SA ($56.18/MWh) has been the lowest for the last 5-years.
TAS was the outlier with an average of $85.24/MWh, lower than last year’s $100.53/MWh but more than 2023 ($70.03/MWh) and 2024 ($73.35/MWh).
The monthly history of spot prices demonstrates that there has been a sustained downward shift in mainland spot prices:
- QLD, NSW and VIC spot prices have stepped-down since Sep-25 and have not been able to deliver any volatile month since Jun-25
- SA has been more volatile with the stand-out months of Jan-26, then the winter months of Jun-25 and Jul-25
- Over the last 4-months, TAS has been relatively consistent around the $85 to $100/MWh range, a little bit less than the same period of the previous year
2.2 Tracking of Q1 Sellers Profit
Looking at the Sellers Profit for Q1 since 2010, the trend continued of Q1 spot prices not living up to the market’s expectations. When the trade weighted average Q1 forward price is compared to the Q1 average spot price, it can be observed:
- QLD has a 4-year run where the Sellers Profit was favourable with the Swap Sellers Profit the second highest on record at $55/MWh, only second to Q1-23 which had $72.70/MWh following the Global Energy Crisis year of 2022. The Cap Sellers Profit was the highest on record at $36/MWh
- NSW also has a 4-year run of a favourable Sellers Profit. The Swap Sellers Profit of $48/MWh rivalled the record setting Q1-23 of $59/MWh and for the last 4-years has not been less than $37/MWh. The Cap Sellers Profit of $29/MWh was very similar to last year’s and the last 2-years have set the record. It is now 6-years that the Cap Sellers Profit has been favourable
- VIC Sellers Profit has been favourable for the last 7-years with the latest Swap outcome being favourable by $30/MWh and the Cap Sellers Profit was similar at $25/MWh
- SA Sellers profit was much smaller due to the extreme prices on Australia Day and was $8/MWh for Swaps and $6/MWh for Caps. These results are much lower than previous years and over the last 7-years, Swap Sellers Profit has been favourable except for 2022 which was only marginally unfavourable by $1/MWh. Cap Sellers Profit has been favourable for 15 of the last 16-years.
2.3 Predictability of what happened?
To measure how predictable was the quarterly spot price outcome, we have reviewed the performance of the forward market’s performance and our probabilistic spot forecast.
2.3.1 Forward Market Performance
The forward market measured about 1 month prior to the commencement of the quarter had a much stronger view of the expected spot prices. All Regions except QLD were trading in our top quartile spot price forecast while QLD fell in our fair value region (i.e. between the 50th and 75th percentile).
The figure below shows our spot price forecast represented as the dial ranging from the 5th to 95th percentile forecast. The dark segments represent the 25th to 75th percentile and the white break mark the median forecast. The needle represents the forward price about 1 month prior to the start of the quarter and is labelled below the dial.
All Regions were regarded as likely to be over-valued and that turned-out to be true except for TAS where the actual spot price exceeded the forward price. TAS is a special case where the market price is set by HydroTas and is also the dominant spot price setter.
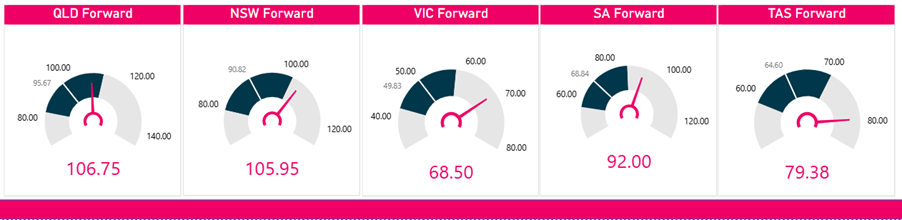
The average forward market absolute error across all Regions was 33%, more than our median spot forecast which is consistent with previous quarters. For the heavily traded Regions of NSW, QLD and VIC, the average error was $33/MWh above the spot price, which is an average premium of 56%.
|
Region |
Forward ($/MWh) |
Actual ($/MWh) |
Error ($/MWh) |
Absolute Error |
Absolute Percentage Error |
|
QLD |
$106.75 |
$65.37 |
$41.38 |
$41.38 |
63% |
|
NSW |
$105.95 |
$73.44 |
$32.51 |
$32.51 |
44% |
|
VIC |
$68.50 |
$42.71 |
$25.79 |
$25.79 |
60% |
|
SA |
$92.00 |
$88.05 |
$3.95 |
$3.95 |
4% |
|
TAS |
$79.38 |
$94.21 |
-$14.83 |
$14.83 |
16% |
|
Average |
$90.52 |
$72.76 |
$17.76 |
$23.69 |
33% |
2.3.2 Probabilistic Spot Forecast
The northern Regions of QLD and NSW finished in the bottom quartile of our spot price forecast. VIC was around our 25th percentile. SA sat above our 75th percentile and TAS finished in the top 5th percentile forecast.
In the following set of dials, the actual spot price is shown as the needle and is labelled below the arrow in the context of our probabilistic spot forecast.
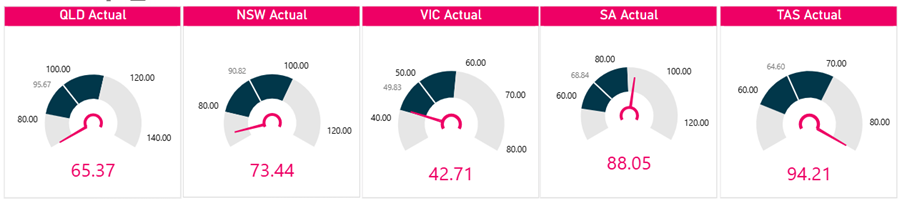
The average absolute percentage error was 28% over the quarter, proving how volatile the spot price can be, reinforcing the need for probabilistic modelling. The average error for the heavily traded Regions of NSW, QLD and VIC was $18/MWh above the actual spot price which was on average 29%.
|
Region |
Median ($/MWh) |
Actual ($/MWh) |
Error ($/MWh) |
Absolute Error |
Absolute Percentage Error |
|
QLD |
$95.67 |
$65.37 |
$30.30 |
$30.30 |
46% |
|
NSW |
$90.82 |
$73.44 |
$17.38 |
$17.38 |
24% |
|
VIC |
$49.83 |
$42.71 |
$7.12 |
$7.12 |
17% |
|
SA |
$68.84 |
$88.05 |
-$19.21 |
$19.21 |
22% |
|
TAS |
$64.60 |
$94.21 |
-$29.61 |
$29.61 |
31% |
|
Average |
$73.95 |
$72.76 |
$1.20 |
$20.73 |
28% |
Given our view that the market was over-valued, if trading was undertaken then a short trading position would be adopted. By doing so, the theoretical profit from a 1MW short position across all mainland Regions would have been $224,000, or $1.1m for 5MW. However, taking a short position across all Regions would require significant capital and create significant lop-sided risk.
Using our risk-adjusted portfolio optimisation systems, for circa $1m capital with about $250,000 Earnings-at-Risk, the trading gain would have been $336,000 for the quarter.
3.0 What Drove Q1-26 Outcomes?
To explain the reasons behind the Q1 performance, a comparison was been made between the average generation by time of day for Q1-26 and the same period in 2025.
In summary the insights are:
- Coal, gas, and mainland hydro generation all experienced reduced output. On average, coal generation fell by 600MW, gas by 290MW, and mainland hydro by 140MW
- There was an increase in wind generation, with the daily bathtub profile rising across all hours. Across the NEM, the average increase was approximately 325MW.
- Both utility-scale and rooftop solar generation increased throughout all mainland regions, with each seeing an average rise of about 310MW.
- Overall, the renewable sector grew by an average of 950MW, with the peak increase of 2,170MW occurring during midday, primarily driven by the solar industry.
- Battery energy storage systems (BESS) continued to charge during low-priced daytime hours, with an average increase of 310MW, though this was less than the increase in renewables during the day. Notably, the charging duration extended, especially in Victoria, due to the average capacity of batteries increasing.
- The BESS dispatched energy targeted the morning and evening peaks, with an average increase of 475MW during the evening peak hours (from 6:00 PM to 8:00 PM) and a maximum average increase of 620MW
In summary, the rise in low-cost generation has led to a decrease in spot prices, although the decline in LGCs mitigated the impact of negative prices. Increased competition for higher peak periods has prevented spot prices from reaching extreme levels. Even during typical heat events, such as temperatures exceeding 40 degrees in Melbourne or 35 degrees in Sydney and Brisbane, the additional competitive generation from battery energy storage systems (BESS) kept prices in check.
The visual below allows you to select either a specific region or the NEM to compare the intraday generation profiles for Q1-26 and Q1-25, highlighting the changes between the two years. While the selection list is extensive, you can choose any region and technology, making it a valuable resource for insights.
4.0 Implications
We anticipate that 2026 and 2027 will represent the low point in the price cycle, before a rebound in 2028. Furthermore, we expect that 2029 will see additional price increases, particularly if the closures of the Eraring and Gladstone Power Stations proceed as anticipated. However, there are concerns that the troubled Snowy 2.0 project may be delayed; as reported in The Australian, Ted Woodley suggested, “It’s 2032 at the earliest.”
If this forecast holds true or is near the mark, the closures of Eraring and Gladstone may also be postponed. Consequently, this could affect the anticipated surge in 2029, and our next forecast revision will assess the potential impact of any delays. If you're interested in exploring our upcoming probabilistic outlook, please let us know.
In the short term, the forward market is experiencing additional corrections. The weakening of the spot market is prompting long traders to reassess their positions and grow increasingly anxious about potential spot outcomes.
Put options have gained in popularity and over the last 8 of the previous 12-months, more Puts have traded than Calls in NSW. This trend was not evident in QLD, and VIC was half the time.
The months of February and April which are either side of the Middle East conflict outbreak, had more Puts traded in NSW and QLD than Calls. This behaviour reflects during February concern about soft spot prices were driving the demand for Puts, then the conflict began and Calls became more popular as the forward market rallied in March. However the spot market has yet to show any global impact and as April rolled-on, low spot prices have continued and so Puts have became popular again.
From January to April 2026, ASX trading volumes were higher in each month compared to the equivalent months since 2022. The month of May is a typical heavy trading month, so it will be interesting to see if this trend continues.
The outlook is the forward market is fighting to retain value. It desperately needs the winter spot prices to show some bite and as always, the spot market should never be taken for granted. But the fundamentals have shifted and the challenge to deliver the forward market value is material. The spot market yearns for another alignment of the planets where forced outages take-out some coal plant, gas powered generation have issues along with severe cold, calm, and cloudy days known as a Triple 'C' Days.
We will be closely monitoring how winter unfolds.
Disclaimer and Notes
Energybyte is published by Empower Analytics Pty Ltd (ABN 38630239002), Authorised Representative no 1274453 of Capital Treasury Solutions (AFSL 429066). Any questions or feedback must be directed to Empower Analytics Pty Ltd as the sole publisher.
