


The Q2-25 forward price gradually declined well below pre-quarter expectations given the softer spot outcomes. This affected the sentiment for all future quarters causing expectations and forward prices to soften. However, before the quarter ended, the stars aligned and June gripped with vengeance.
The surge in June 2025 spot prices led to the recovery of the quarterly average to become the second highest in history for all Regions, except for Queensland which was the fourth highest on record.
Financial year averages were also escalated by the June result, leading to the final result being in the top 5 historical averages varying by Region.
1.0 Electricity Spot Prices
The average monthly price history is shown in this Section along with the financial year history for each Region. We then compare the actual spot prices and cap payouts with our probabilistic spot forecast prepared before the quarter started. It has been a miraculous recovery during the quarter.
1.1 Month of June
The average June spot prices was the second highest in history, only beaten by June 2022 in all Regions, except for QLD which was 4th placed. The QNI was often constrained during the NSW extreme price events, and therefore was islanded and finished with a lower average than other NEM Regions.
The history of June average spot prices is shown below and you can select the Region from the drop-down list.
1.2 Quarter Q2-25
Looking at the monthly make-up of the Q2 quarters, it is evident how influential June was in Q2-25 and without such a stand-out outcome, the quarterly average would have been soft, and most likely been the lowest in the last 4-years.
1.2 Financial Year
Looking at financial year history, the FY-24/25 for each Region was:
- QLD delivered $109.54/MWh which was the 3rd highest history
- NSW finished at $128.16/MWh, also the 3rd highest in history
- VIC closed at $86.84/MWh which was the 5th highest in history and exceeded last year's $63.29/MWh comfortably
- SA settled at $104.32/MWh, the 5th highest on record
- TAS averaged $109.26/MWh and was the second highest on record, just behind the record FY-22/23 of $111.98/MWh
You are welcome to use the legend to click Regions on or off to improve clarify.
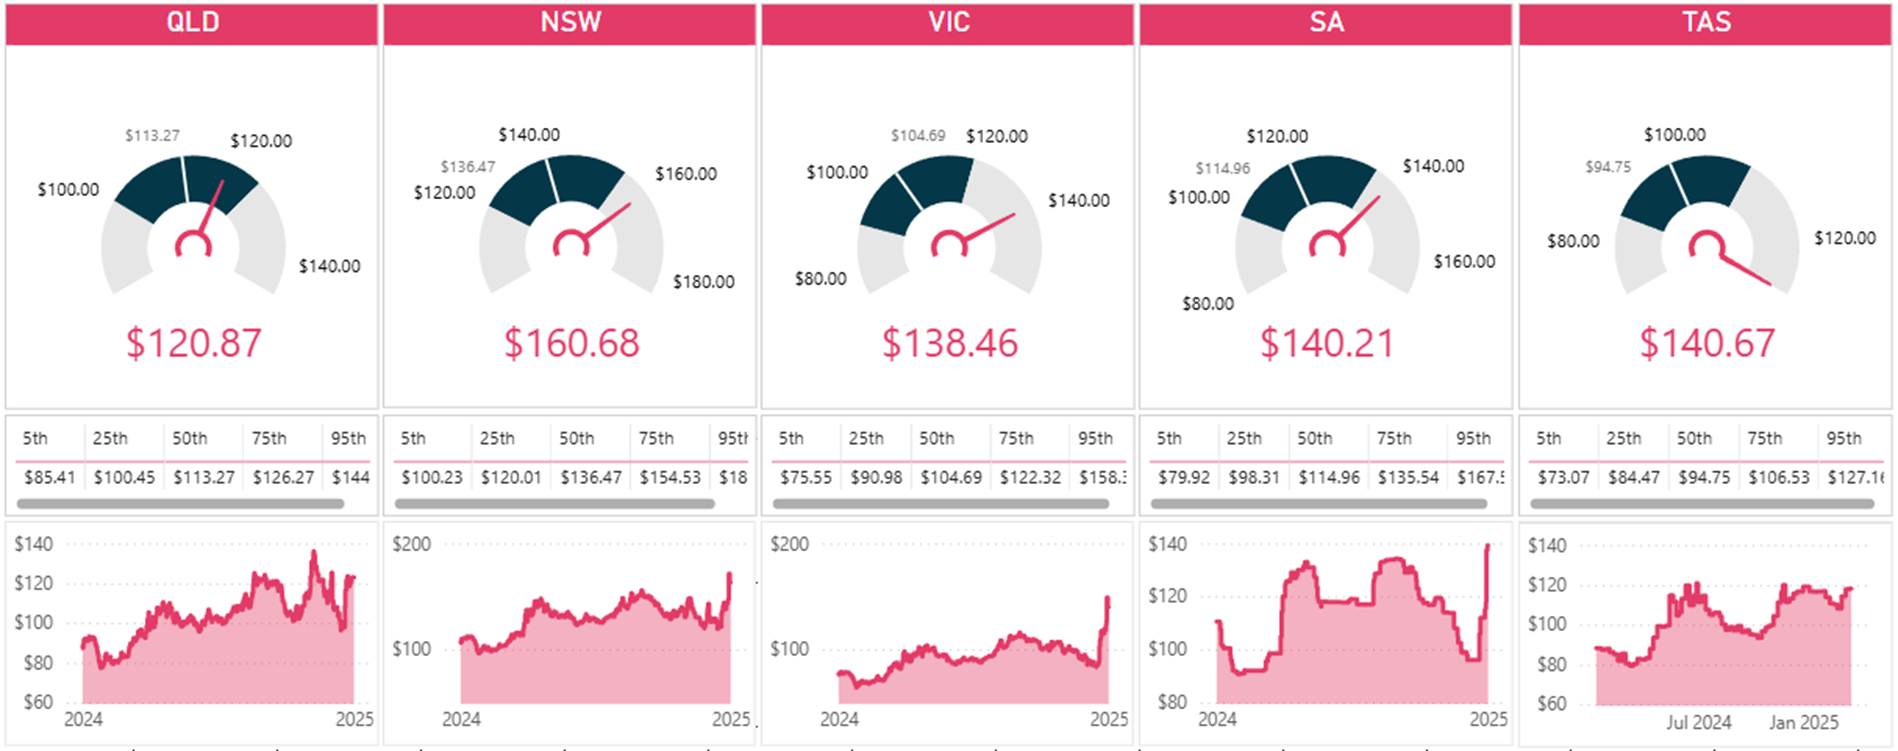
1.3 Spot Price Forecast
The quarterly average price was compared to our probabilistic spot price forecast using our fourcast probabilistic system. The results show that due to the June recovery, the average spot prices finished in our top quartile for all Regions except for QLD, which was midway between our median and 75th percentile.
At the end of May-25, the actual spot prices were mostly tracking in our bottom quartile, so a remarkable change in the end.
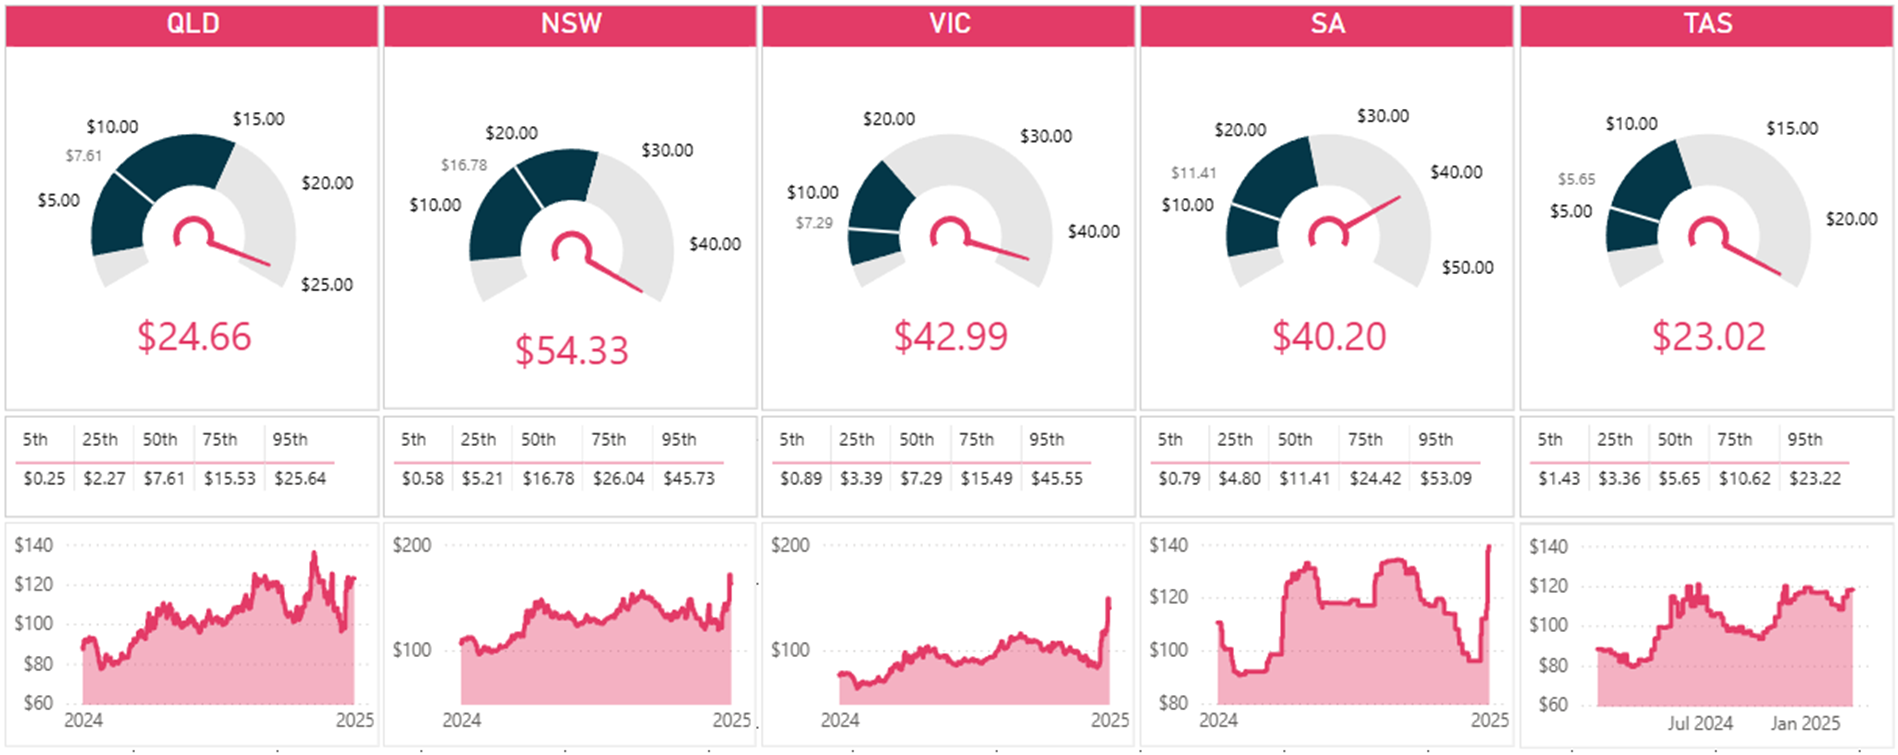
The volatility measured by the $300/MWh cap payouts was in our top quartile for all Regions. A popular location was near, or at, our 95th percentile. For QLD, VIC and TAS the actual payout was near our 95th percentile forecast, while NSW exceeded our 95th percentile; and SA was near our 90th percentile. Quite an extraordinary result.
2.0 ASX Trading
The swaps and caps traded on ASX Energy, typically has June trading about a quarter of the May volumes. However, this was not the case in 2025. The quantity traded for June was just less than May, but the month of May was about half the previous year. If May and June are aggregated, they traded a bit less than May and June aggregation of last year.
In our Monthly Report, we will also report on the average rate options, which are a material quantity and show how risk management using financial derivatives has ramped-up over the 2022 to 2025 period.
You can swipe the following chart to zoom in, if you wish.
In our June Financial Market Report we will share our findings on ASX Energy trading, and we note that the new Peak Morning and Evening contracts have been listed, starting with NSW on last Monday. Then QLD will follow on 7 July, VIC on 21 July and finally SA on 28 July.
There are 4 NSW Peak Evening quarters that have already traded, and interest is expected to grow quickly.
3.0 Comparison with June 2022
Given the significance of June 2025, and the fact that it was generally the second highest in history to June 2022, we thought it would be interesting to compare some key attributes between the two years.
You may recall that Q2-22 was a very torrid ride, with electricity and gas spot price undergoing a step change, extreme prices events, thermal coal prices escalating, 5 Retailers failing during the winter of 2022, Administered Prices were invoked, RERT was activated and then AEMO suspended the NEM for 9 days and took control across the whole NEM for the market's first time in history.
We even wrote a article about linking the price of iceberg lettuce and power prices. These were strange times
3.1 Daily Electricity Spot Prices
Beginning with the average daily spot prices, the chart below shows that June 2025 had 4 exceptional days and if the 27 July had delivered to the predispatch forecast, the Administrative Price Cap would be been introduced, like June 2022. However, the forecast prices faded, and so the Cumulative Price Threshold was not exceeded.
Looking at 2022, the extreme average daily prices were not as great as 2025, but had more of a sustained daily price outcome.
3.2 Daily Gas Prices
In June 2025, the daily gas spot prices reached the highs of approaching $20/GJ, whereas in June 2022, the maxima was closer to $45/GJ. A dramatic difference and you may recall for the winter of 2022, that some gas powered generation could not run at the $300/MWh administrative price cap profitably, which led AEMO to suspend the market and take control of the assets. Following this event, the Administration Price Cap was revised to $600/MWh.
June 2025
June 2022
3.3 Intraday Electricity Spot Prices
The intraday prices behaved differently between 2022 and 2025 and we will explain more in our June Spot Price Monthly Report, due out shortly.
3.4 Generation Technology
The generation technology has materially changed over the 3-years beginning with about 650MW of battery capacity dispatched in June 2022, compared to June 2025 of closer to 3,500MW.
Other highlights from the chart below are:
- Black coal was higher in 2025 due to less forced outages
- Brown coal of 2025 was similar to 2022, reflecting in both years, forced outages were evident
- Despite a higher gas price in 2022, gas powered generation produced more energy than 2025 but remembering those gas units were compensated to run during the Market Suspension period
- Roof-top solar has continued to grow, although all extreme spot prices in 2025 were outside of solar hours
- Utility scale solar has increased by over 400GWh over the 3-years, but once again, had no relevance to the extreme prices
- Wind capacity has increased by about 400GWh, but little wind was produced at the extreme price times
- Hydro generation was far less in 2025 due to less abundant water storage levels at Snowy Hydro and more risk-averse behaviour of HydroTas
3.5 Generation Outages
We have used a few different measures to track generator outages and it is fertile ground to find a new metric, as not all outages are equal.
Many, many years ago before the deregulation of the electricity industry, I was working in the public transport sector. I can recall proposing to hardcore rail Executives that train on-time performance statistics should be measured in terms of ‘passenger late minutes’. As not every train is equal.
A late crowded train bursting at the seams is more critical to be on-time than an almost empty late train. The Executives firmly advised me that if it wasn’t for passengers, they could run a great rail system. I was obviously mistaken. I thought the train system was there because of passengers, not the other way around.
Following the same theme, I was also told that country trains air-conditioning works just fine, … , except when it is hot.
All of this brings me back to generator outages. We need a metric that measures the consequence of an outage. An outage in the middle of the day during a windy and sunny day, has a very different impact to an outage at 7:00pm during a calm and cold wintry night in June.
We will try exploring the concept of ‘Outage Price Impact’ to measure the impact of outages, which will then consider the magnitude, coincidence and price consequence of outages. We will see how we go.
3.6 Water Storages
As shown in the chart below, in June 2022 Snowy Hydro’s Lake Eucumbene was at an average capacity of 52% in 2022, compared to just under 40% in 2025. You are welcome to swipe the chart to zoom in.
Looking at HydroTas water storage system, in June 2022 and June 2025 water storage levels were at similar levels of around 33%. Although looking at HydroTas’ generator offers, it appears HydroTas is being more risk-averse this year. You’ll recall that HydroTas water levels became more critical in June 2024, so Tamar Valley power station became operational for the first time in 7-years and operated through the winter to conserve water. We expect the recent memories of last year, are influencing how HydroTas is valuing the water.
3.7 Offers-at-Risk
We have done some research to measure what we call ‘Capacity-at-Risk’. That is capacity that was offered in a price band that was not dispatched. We have measured this metric during June 2022 and June 2025, as well as during extreme price events in both years. We will discuss more in our June Generator Monthly Report, due to be released shortly.
3.8 Interconnector Flows
For key observations of major interconnector flows during June 2022 and June 2024 are:
- QNI interconnector net flows were similar between the two comparative years
- net energy flow from VIC to NSW increased, although during the extreme price events, the flow was to the higher price VIC Region
- net energy flow from VIC to TAS increased, although once again, during the extreme prices, flows were reversed
- far less net energy flowed from VIC to SA
4.0 More Detail
More reporting and commentary will follow in our Monthly Reports of the financial market, spot markets and generation available through a subscription.
Disclaimer and Notes
Energybyte is published by Empower Analytics Pty Ltd (ABN 38630239002), Authorised Representative no 1274453 of Capital Treasury Solutions (AFSL 429066). Any questions or feedback must be directed to Empower Analytics Pty Ltd as the sole publisher.
This newsletter contains general information and is not advice to buy or sell any position.
Empower Analytics has exercised professional care in the preparation of this newsletter, the information includes data from third parties which is not independently verified, and it is current at the date of publication. Empower Analytics is under no obligation to update this data.
