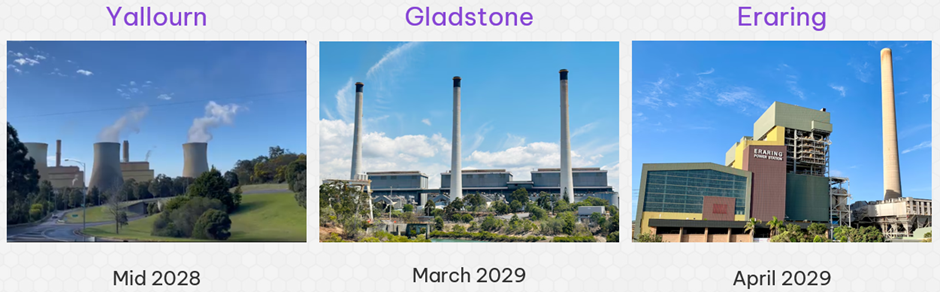
Record low QLD and NSW prices for 2026 and 2027 have evolved while VIC has held firm at lower levels. However, by mid-2028 the Yallourn closure will trigger the price bounce consolidated by the Gladstone and Earing closures in 2029. Higher prices are then expected to prevail for the next 3 years.
In recent months, Queensland (QLD) and New South Wales (NSW) have seen record low forward prices for 2026 and 2027, while Victoria (VIC) has maintained a more stable, albeit lower, price level. However, with the planned closure of the Yallourn power station in mid-2028, there is an expectation of a price rebound, reinforced by the anticipated closures of Gladstone and Eraring in 2029. Higher prices are projected to persist over the subsequent three years.
The Outlook
The outlook for the National Electricity Market (NEM) remains cautious as it absorbs the influx of new generation capacity that has recently come online, which will continue to expand over the next two years. However, the combined effect of the scheduled closures of Yallourn in mid-2028, Gladstone in March 2029, and Eraring in April 2029 along with a slower build of new capacity, will likely lead to a tipping point, resulting in a significant surge in market prices.
This convergence of closures in 2029 mirrors the situation in 2017, where the cumulative impact of closed capacity, rather than solely the closure of Hazelwood, coupled with a reset of gas prices to global parity, ignited a price surge that lasted until 2020.
The year 2029 is poised to be a pivotal moment for the market, signalling the beginning of a price spike that could create concerns for both Governments and consumers, both large and small. It is anticipated that this shift will act as a catalyst for many stalled projects to finally achieve financial closure and move forward after years of inactivity.
Power Purchase Agreements (PPAs) are expected to regain popularity as they provide protection against forthcoming higher price levels in exchange for contract duration.
Not all segments will benefit equally, however. Solar farms are likely to continue to face challenges from persistently low daytime prices and diminished certificate values, compromising their financial viability. Solar and battery hybrid developments may partially mitigate these issues by absorbing both previously curtailed energy as well as low-reward dispatched energy. The ongoing reality is that while a solar farm requires battery storage, the reverse is not true.
Daytime prices will continue to be pressured by surges in rooftop solar installations. Although expansions in home battery systems, increased adoption of electric vehicles, and projects like Snowy 2.0 and other pump storage solutions should help ease some of this burden. Our modelling suggests that significant rebounds in daytime prices are unlikely until the 2030's.
The Australian Energy Market Commission's (AEMC) has launched an initiative to incentivise large users to shift demand to daytime (Minimum System Load Transitional Services). It does make you wonder, rather than relying on user-funded initiatives, a more straightforward solution would be to enforce multipart tariffs that align with spot power costs, motivating all consumers to adjust their usage habits accordingly. For those trapped in energy poverty, the overall advantages of sharper price signals to move demand from critical peak periods to daytime periods will lower the overall cost for all, and some of these benefits could be harnessed to subsidise access for vulnerable customers.
Initial expectations regarding the Capacity Investment Scheme (CIS) as a transformative tool to bridge the gap between Power Purchase Agreement buyers and developers have not quite materialised. Developers face rising costs, delays in connections, lengthy equipment queues, and a skill shortage, ultimately complicating the project realisation process and leading to increased asking prices.
Evidence suggests that the rate of successful conversions from CIS tender wins to financial closures has been lower than expected. It seems developers often bid low in the auction process to secure CIS support but find that the resulting revenue streams do not satisfy project lenders, forcing them to seek additional PPAs to bolster their revenue assurances. The net result of this predicament is that the installed capacity is not coming online as fast as conceived.
From a buyer's perspective, declining near-term forward prices, deteriorating wind and solar hedge effectiveness, coupled with a drop in certificate values, have weakened the interest in new PPAs. There has also been some Buyers Regret emerge with predecessor PPAs, especially solar farm PPAs, adding to the reticence to transact.
Looking ahead, the price projections for :
- Victoria indicate a potential upswing beginning in 2028, lasting through 2031, assuming no offshore wind projects are subsidised to connect to the grid, although these will take many years before the turbines spin. Projections show without any radical change Victoria is facing a median spot price above $100/MWh in 2028, and 2029 is likely to be more than $150/MWh which is about twice 2026 predicted levels. By 2032, prices around $75/MWh are expected
- For New South Wales, prices are expected to soften through the 2026 to 2028 years, then jump in 2029 to about $135/MWh, then gradually fall until 2032 reaching about $75/MWh
- Queensland is also expected to soften through the 2026 to 2028 period, then jump in 2029 to around $105/MWh , then push up again to $155/MWh for 2030 and 2031 before receding by 2033 to around $$78/MWh
- South Australia is expected to strengthen as Energy Connect comes online through the 2027 to 2028 years, before jumping in 2029 to around $140/MWh, before falling over the next 3-years. By 2032 is expected to be around $78/MWh, lower than 2026 predictions
- Tasmania is expected to hover around high $60's to mid $70's over the next 3-years, then begin the climb in 2029 to around $89/MWh led by Victoria; and then in 2030 with MarinusLink operating is expected to push up to $108/MWh in 2030. Thereafter is expected to decline and by 2034 is expected to return to 2026 levels of around $$60/MWh
Further detail is provided in the Appendix for subscribers.
Current Trends
The current trends of soft pricing are approaching a juncture where, barring unexpected soft price outcomes in March and April, there should be a reinforcement of market strength leading to forward prices rallying. Recent geopolitical events in the Middle East are also likely to impact perceptions of global energy prices and remind us of the ramifications stemming from Russia's invasion of Ukraine, which led Europe to explore alternative energy sources, subsequently influencing Australian natural gas and thermal coal prices.
In February, average spot prices across all mainland regions reached their lowest levels since 2021, although the decline was marginal. Combining January and February average prices results in the lowest first-quarter average for New South Wales, Victoria, and Queensland since 2021, while South Australia remains an outlier, primarily affected by the Australia Day event. Tasmania continues to deliver lower prices than last year, but more than the previous years since 2019.
As of the end of February, the forward market is depressed, hovering around the 25th percentile for projected prices in 2026 where this assessment predates any specific knowledge of actual first-quarter outcomes. Within the first quarter of 2026, the forecasts show Queensland at significantly low prices, New South Wales near the 25th percentile, Victoria at about the 32nd percentile, and South Australia still in the top quartile, thanks mostly to the Australia Day event boost. Given the positioning of the forward prices as at the end of February, there is plenty of scope for the market to rally.
Looking forward into 2027, the Queensland forward market appears fairly priced although is likely to move if New South Wales does so, while New South Wales remains below median forecasts, Victoria shows softness near the 25th percentile, and South Australia sits even lower, below the 25th percentile threshold. The implications also suggest a likelihood of market rally rather than further softening.
The Appendix shows further detail for subscribers.

The chart pack includes 4 sections consisting of:
- historical plant closures
- forward prices
- spot price forecasts
- actual spot prices
Appendix A: Plant Closures
A recap of the historical plant closures is shown below and it can be noted that by the time Hazelwood closed in 2017, there was an accumulated retired capacity had increased to 5,850MW.
Appendix B: Forward Prices
This section outlines the forward prices trends and value proposition.
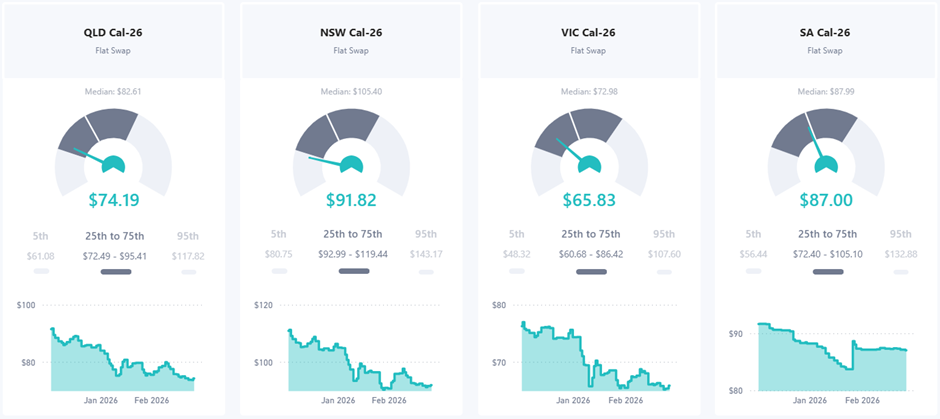
B1: Calendar Year 2026
The figure below shows the 2026 spot forecast and the needle on each dial marks the forward price as at 28 February 2026. The dial segments represent from left to right the 5th to 25th, 25th to median (white line between the dark segments), median to 75th percentile and then finally the 75th to 95th percentile spot forecast. The chart below the dial shows the journey of the forward price over the last 3-months.
The 2026 outlook shows QLD and NSW are particularly low, sitting near the 25th percentile; while VIC is stronger residing at the 32nd percentile and SA is just under the median. Given the low location on the dial, all Regions are regarded more likely to rise than fall further.
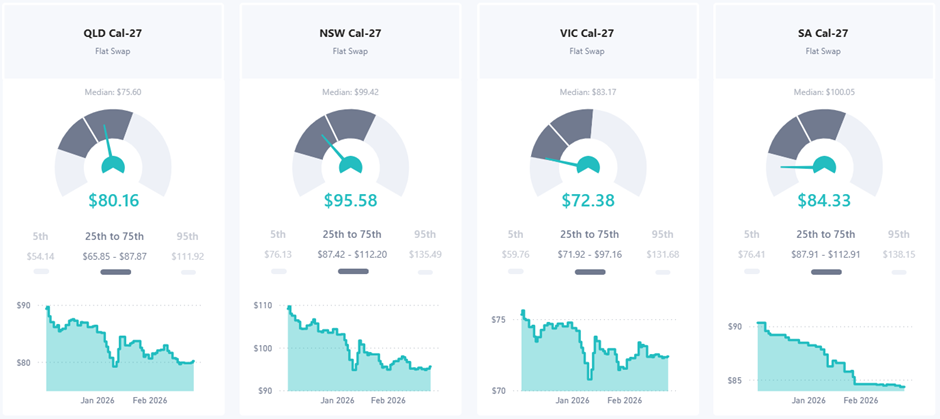
B2: Calendar Year 2027
For 2027, the assessment is that QLD is located in our fair value region of between the median and 75th percentile, NSW is below the median and therefore more likely to rise than fall. VIC and SA are near the 25th percentile and therefore are also very prone to rally.