


In the second quarter of 2022, Australia experienced exceptional gas and electricity prices triggered by the Russian invasion of Ukraine causing Europe to seek alternative energy sources. Is this year on a similar trajectory because of the ongoing Middle East conflict?
Russia's “special military operation" on Ukraine began on 24 February 2022. Fast forward after the fourth anniversary when on 28 February 2026 the USA and Israeli armed forces executed strikes against Iran under the code names “Operation Epic Fury” and “Operation Rising Lion”, respectively. These strikes targeted Iranian military infrastructure, leadership, and missile capabilities, resulting in significant casualties, including the death of Iran's Supreme Leader, Ali Khamenei.
The global oil and LNG markets have been significantly impacted by the ongoing Middle East conflict. As petrol and oil prices surge at the petrol station, consumers and logistic companies are experiencing increased cost pressures. Inflationary pressures are mounting, raising questions about whether electricity demand will be tempered by an economy slow down.
Despite the potential softer electricity demand, if the market faces other events such as a spike in unplanned outages, a wind drought etc, will these global impacts lead to a repeat of 2022?
1.0 A Re-Cap of 2022
In 2022, the surge in forward and spot prices was the result of multiple interlinked factors. Notably, the entire NEM (National Electricity Market) experienced its first suspension from 15 to 24 June 2022, due to soaring input gas and thermal coal prices, baseload outages, at times low wind yields, etc.
Gas-fired generation became untenable for AEMO to manage as the administered cap was at $300/MWh which at times was below their costs. This cap was revised upward to $600/MWh on 1 July 2022, aimed at stabilising the market.
Here is the timeline for the 2022 events:
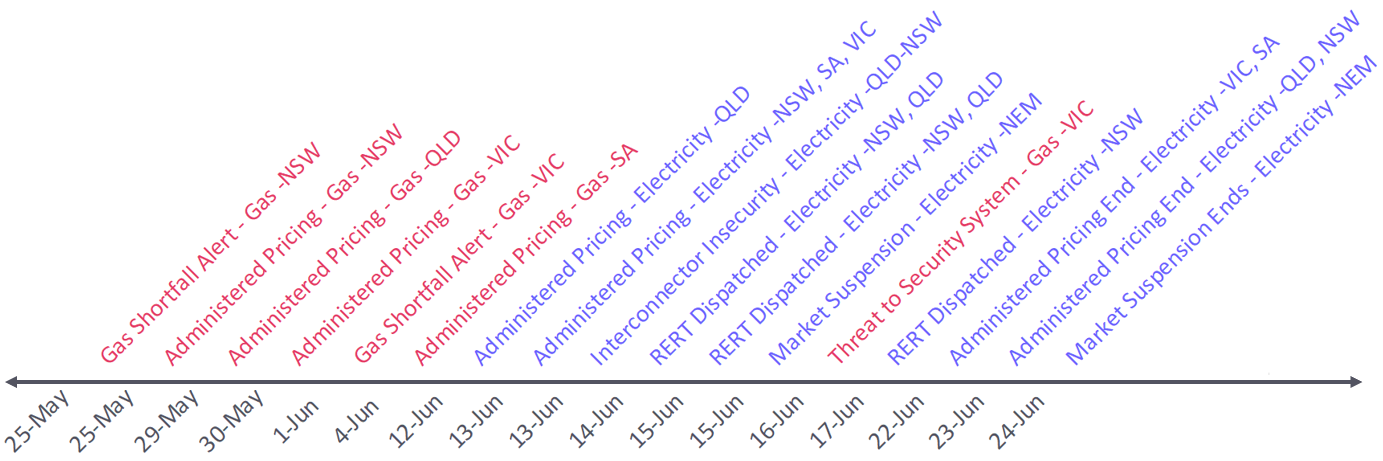
1.1 Market Suspensions
Reflecting on market suspensions, from memory there have only been three occasions where an individual Region was been suspended, contrasting sharply with the unprecedented NEM-wide suspension in 2022. The other instances were:
- Queensland Market (February 1998): Experienced a false start after commencing on 18 January 1998 but due to unintended extreme price consequences, suspended operations on 1 February 1998 until 22 March 1998
- South Australia Market (September 2016): Suspended from 28 September to 5 October 2016, following a storm that knocked over transmission towers, leading to blackouts.
- New South Wales (March 2026): Recently suspended on 8 March 2026 due to SCADA-related technical issues.
1.2 Baseload Outages
In winter 2022, outages impacted a significant portion of baseload plants, as illustrated by the accompanying chart measuring MWh of outages over time. Notably, high outage levels occurred from April to May and September to November 2022. This analysis excludes Liddell Power Station to maintain consistency over the period.
Each outage megawatt carries different implications. An outage during daylight hours, when solar generation is abundant and demand is low, has a very different consequence compared to an evening outage during cold winter nights with high demand.
To quantify the impact of outages, we assessed the prevailing spot prices during each outage period to derive the Outage Value. Although this metric is somewhat circular, since outages can drive up spot prices, it provides valuable insights into the economic ramifications of outages.
The Outage Value over winter of 2022 is a stand-out in the market's history.
2.0 Comparison with 2022
Using the NSW Q2 forward base swap prices as our primary indicator between the two eras, we overlaid daily prices for 2026 with those of 2022. The chart illustrates that at the beginning of 2026, the Q2-26 quarter price started at noticeably higher levels than the 2022 counterpart at the same time of the year. However, the surge in prices experienced in March 2022 has not yet been matched in 2026. Instead, the Q2-26 forward has been holding steady around the $112/MWh mark .
In Q2-22, forward prices peaked above $300/MWh just before the market suspension on 15 June. The exceptional conditions of 2022 flowed into Q3, where NSW Q3-22 prices reached $365/MWh.
The market's financial stress during the winter of 2022 led to the revocation of 5 retail licenses. Currently, 15 retail licences have been revoked.
For retail customers that were hedged throughout the tumultuous winter of 2022, the situation was more tolerable, but they too felt the ripple effects of rising costs in subsequent pricing terms. For example, Cal-23 forward prices demonstrated a significant surge tempering slightly in December 2022 when uncontracted gas and thermal coal price caps were invoked.
The Cal-27 forward prices have increased, but the rally commenced before the Middle East conflict began. We previously wrote our Soft Prices Ready to Rally article that the market prices were undervalued according to our probabilistic modelling.
Since the Middle East conflict started, NSW has increased the most increasing from about $95.50/MWh on 27 Feb-26 to over $111/MWh, a $15.50/MWh increase. Over the same period, Queensland has increased by over $11/MWh to $91.30/MWh, Victoria a $6.90/MWh increase to $79.25/MWh and then South Australia a $5.70/MWh increase to $90/MWh.
The daily spot prices for electricity and gas from 1 April to 30 September 2022, reveal the depth of price volatility, with gas prices surging beyond the capped price of $40/GJ.
3.0 Spot Prices for 2026
As a lead into the Q2-26 quarter, we note the dichotomy between the forward prices and the spot prices. The Q1-26 spot prices have almost finished for the quarter and spot prices have not yet reflected the upward pressure of the forward prices. The Q1-26 year-to-date the spot prices are:
- Queensland at $65.60/MWh is on track to be the lowest since 2021
- New South Wales at $73.70/MWh is also on track as the lowest since 2021
- Victoria at $43.10/MWh is tracking to be the lowest across the NEM and will likely also be the lowest since 2021
- South Australia is tracking as the highest on the mainland finishing at $89.10/MWh, driven by the exceptional Australia Day event
- Tasmania at $94.20/MWh is tracking lower than last year’s $111.46/MWh, but more than the previous 5-years
4.0 Buyers Risk Appetite
In our portfolio optimisation modelling, we apply a risk-adjusting approach to trading or hedging strategies. We utilised a similar technique to assess the NSW Q2-26 prices, measuring what we refer to as “Buyers Risk Appetite”.
The results indicate that while the Buyers Risk Appetite remained relatively stable through 2025, it peaked just before the Middle East conflict began before collapsing below 2025 levels as the conflict escalated.
During last week, the Buyers Risk Appetite is increasing as the market is becoming less fearful of the pending quarter. The soft spot prices during March, would no doubt feed into April’s perception.
The month of April is also an intrinsically low price month, due to mild weather, Easter and School Holidays. However, the days are also becoming shorter impacting solar irradiance, and April can be relatively calm impacting wind generation.
5.0 Conclusion
The 2022 market event illustrated that extreme events usually require multiple factors to align. A combination of high natural gas and thermal coal costs, coupled with significant outages, led to a strained market, resulting in rapid increases in both spot and forward prices.
Currently, while pressures are not as fierce in 2026 as they were in 2022, there remains a higher risk associated with the impending Q2 (and likely Q3) than was observed in mid-February 2022.
Only time will tell how the market will unfold.
Disclaimer and Notes
Energybyte is published by Empower Analytics Pty Ltd (ABN 38630239002), Authorised Representative no 1274453 of Capital Treasury Solutions (AFSL 429066). Any questions or feedback must be directed to Empower Analytics Pty Ltd as the sole publisher.
